
Friends,
I had requested Tannoy to send me the impedance curve for the Tannoy Turnberry SE speakers. They have sent me this:
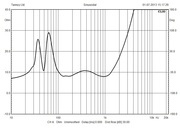
I am not sure what exactly to make out from this graph. Can someone please help me read this graph and make some general inferences out of it ? Especially what kind of amplification works for this speaker etc etc.
Tannoy has requested me to give a feedback for their customer service, I dont even know how helpful this graph is hyeah:
I had requested Tannoy to send me the impedance curve for the Tannoy Turnberry SE speakers. They have sent me this:
I am not sure what exactly to make out from this graph. Can someone please help me read this graph and make some general inferences out of it ? Especially what kind of amplification works for this speaker etc etc.
Tannoy has requested me to give a feedback for their customer service, I dont even know how helpful this graph is
hyeah:")