Vineethkumar01
Well-Known Member
Hi All,
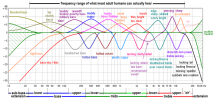
I found this very interesting graph which shows how we interpret peaks and dips in the frequency response at different frequency ranges over here:

 diyaudioheaven.wordpress.com
Looks very interesting but I cannot vouch for the accuracy of this material...")
I found this very interesting graph which shows how we interpret peaks and dips in the frequency response at different frequency ranges over here:
Frequency response
home back to Learn back to How to interpret graphs published: Mar-18-2017, updated: Sep-6-2020 Frequency response deviations, as well as phase response, are so called ‘linear distortions̵…
diyaudioheaven.wordpress.com
Looks very interesting but I cannot vouch for the accuracy of this material...