Love4sound
Well-Known Member
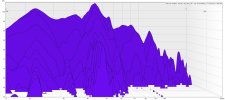
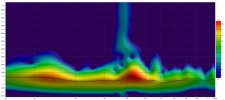
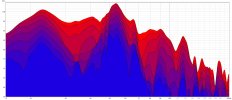
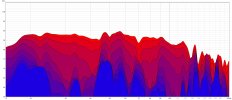
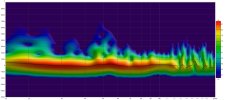
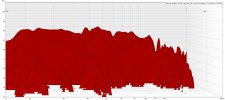
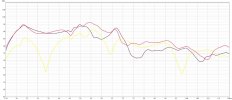
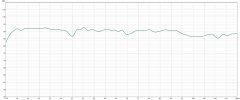
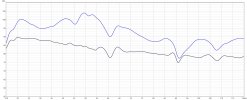
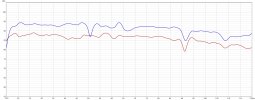
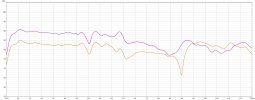
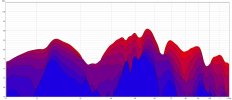
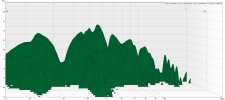
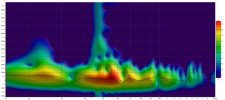
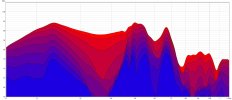
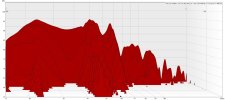
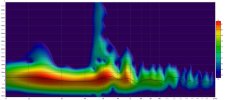
I guess it’s safe to assume a few members are good with rew and we have a handful number of rew users. Most discussions on rew we only look or discuss about SPL graph. However other graphs like waterfall,decay and spectrogram isn’t discussed much. If any clear article available please share. I generated them but have no idea how to interpret them. If any one is aware please explain. I have shared all 3 for my front and rear subs. How bad is it? Treatable bad or untreatable bad?
Attachments
-
 8E575F57-6A2C-4B01-8316-291CC9311EC5.jpeg113.7 KB · Views: 37
 -
 401FD3B3-28B5-4E59-8C9C-8A18BBEED699.jpeg90.8 KB · Views: 33
 -
 957289BC-03BF-4EE2-BB47-0BF43B0AA716.jpeg102.5 KB · Views: 33
 -
 B3B19D4E-21CC-499B-8CA6-3C08D1244FBB.jpeg114 KB · Views: 32
 -
 DC9AD623-DC8C-4F3B-9555-1701621D6CF4.jpeg94.3 KB · Views: 32
 -
 FE51C34E-B3C5-4060-832B-A391A67622DF.jpeg101.6 KB · Views: 34